What is Data Paging and How can it Save You Time?
Source Feeds with an index can be tedious and confusing. Learn how to use data paging for a clean, efficient way of sending multiple pieces of data fields to a single file.
David Grotzinger on 7/11/2022
Categories: Venus Control Suite Training

Depending on your Venus Control Suite package, you might have seen some changes in your account. We’ve talked about the:
Let’s move into the integration of Data Studio and the Scheduling App.
What do you see inside Data Studio?
With the new Easy Drop Weather, every account in VCS should have a Data Studio App. If you are in account packages Basic and Select, you will only see the Easy Drop Weather source. The “add source” button is only available in packages Professional and Enterprise.
What is a Data Source with an Index?
A data source can have multiple channels. The index just refers to the ability to change the source’s channel and pull different data. Notice, by changing the “item” line you can see the information available to pull change along with it.
If you do not have the ability to add sources, the Easy drop Weather forecast section is a great use for data paging!
Without Data Paging
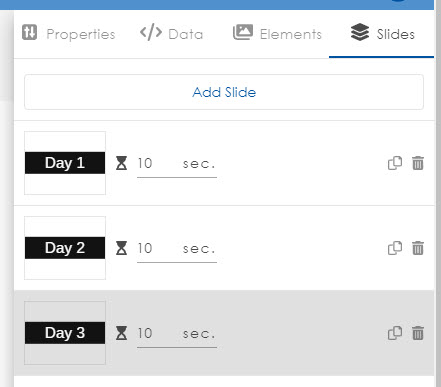
Let’s say you want to display the Easy Drop Weather forecast information for days 1-3, and you wanted each day to have it’s own screen time. Traditionally, you would need to create a slide for each day. On top of that, you would also need to format each text boxes’ appearance to keep a uniform look. This can be tedious… especially for the more in depth data feeds.

With Data Paging!
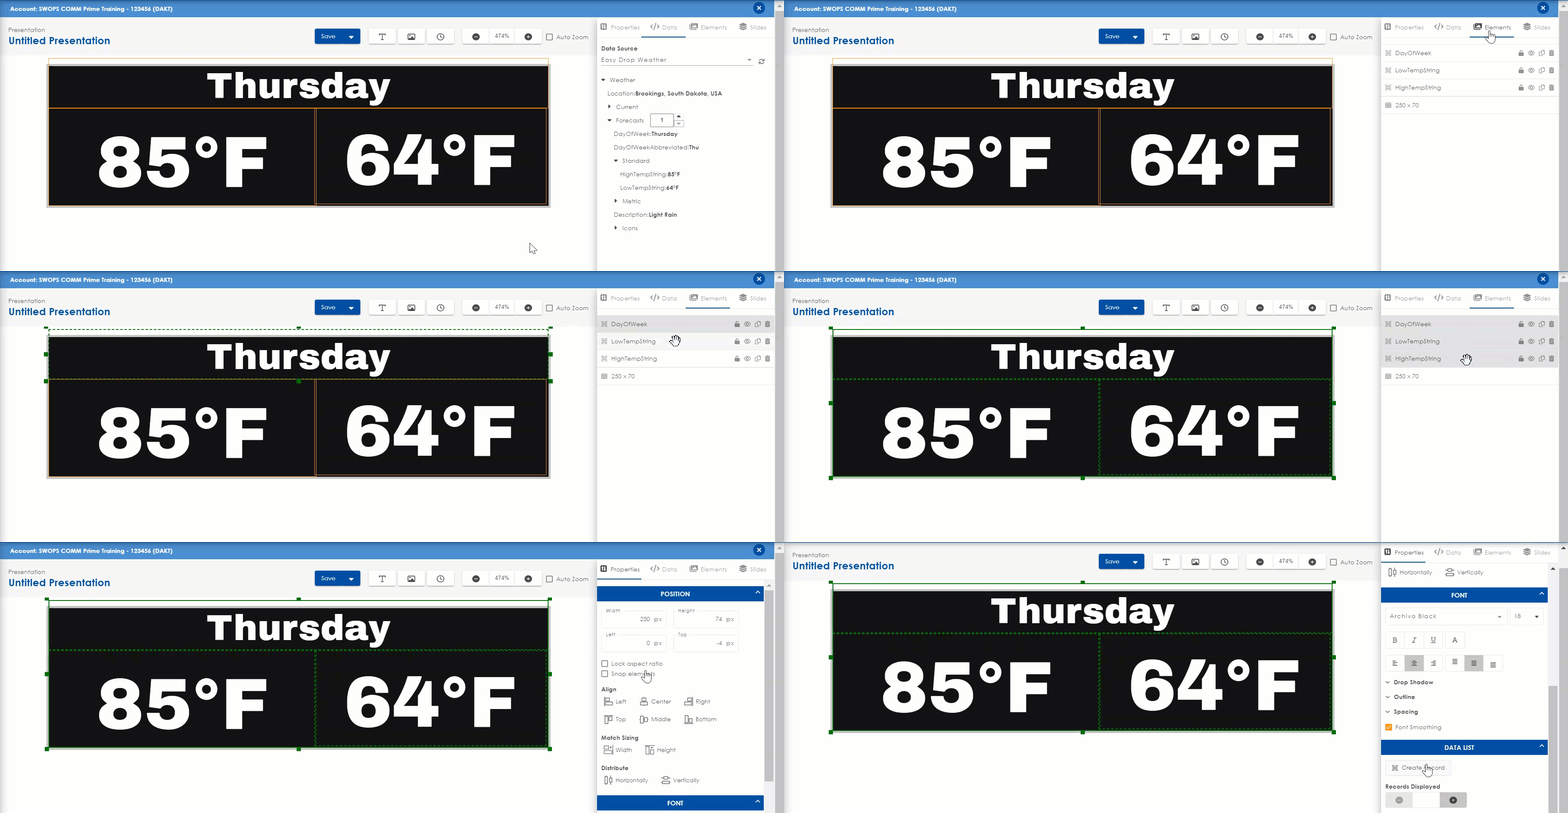
Data Paging removes the extra steps, allowing you to focus on one slide. Once you have created the first slide you can take control of how many sources you want to display, and for how long. Let’s continue the example of a 3 day forecast. The first slide for Forecast Channel 1 has been created.

Instead of adding additional slides, head to “elements” to highlight all data fields by holding control on your keyboard and clicking each element.

Since the example is displaying one day at a time you will need to leave records displayed at 1. Any additional days can be added by clicking the plus sign. Although, this will require you to format and fit all additional data fields. If you drop down the paging section, you will be able to control the hold times for each source. Make sure to check the box “Page Records” to ensure you are changing the record you just created.
How many times will the source change?
This will be determined by two factors:
- Hold Time – The time set for the record’s data. When the hold time ends the new set of data populates.
- Slide Duration – The time set for each slide. Ideally, this number will be a multiple of the hold time for even playouts.
In the example above, you can only see the current data set. Which is the Day of week, High temperature, and Low temperature for Day 1, Thursday. After the initial 5 seconds of the file, the hold time ends prompting to change the data list properties for Day 2, Friday. Since the slide duration is 15 seconds you will end up showing the high and low temperatures of Thursday, Friday, and Saturday each for 5 seconds.
5 second Hold Time x 3 days = 15 second Slide Duration
As the record changes the data list the following information will replace in the text boxes.
For any questions or ongoing support please visit the following:
- Venus Control Suite Onboarding Website
- call our Help Desk at 1-800-325-8766
- Contact a Trainer


