Troubleshooting RTD for Fall Sports
Real Time Data (RTD) is often a huge part of a video board show. Examples include player stats, clocks, out-of-town scores, Tweets, closed captioning, or shot charts. There are numerous interface options for displaying data in Daktronics control systems, and depending on the application, you may use one or more. Being able to troubleshoot RTD […]
Daktronics Control Panel on 8/27/2015
Categories: Pro Sports and Colleges
 Real Time Data (RTD) is often a huge part of a video board show.

Examples include player stats, clocks, out-of-town scores, Tweets, closed captioning, or shot charts. There are numerous interface options for displaying data in Daktronics control systems, and depending on the application, you may use one or more. Being able to troubleshoot RTD is critical for successful operation because it can get complex. RTD often involves multiple computers, ports, cables, and network settings, all configured correctly to work, and a single change in any of these could be the reason behind RTD issues.
Below is a list of things to keep in mind for successful RTD integration.
- Pre-event checks. Checking each data source prior to every event is critical to success. Keep in mind that typically, RTD comes from multiple sources (AllSport, StatCrew, DXTR, GSIS, DakStats, etc.) therefore testing just one does not ensure they all work. Ensure your pre-game routine includes a check of all data sources you plan to use for the show. The Daktronics Maintenance Guide has examples of how to complete computer and display checks.
- Know the signal flow. Just like with any other production system, there is a signal flow to RTD. The signal path is made up of both hardware and software between the point of origin, and the DMP (7000 or 8000) output. Unfortunately, each connection point can be a point of failure. Good troubleshooting skills require the knowledge of where these points exist, and how to provide a quick resolution.
- Use monitoring tools. Daktronics has multiple pieces of software that allow for port monitoring at different points in the signal chain. If you have a DSTI computer, the Monitor Ports tool
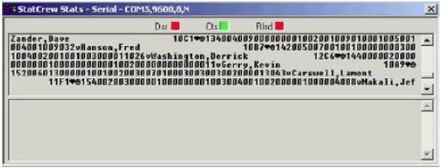 (in the View menu), is often good starting point when troubleshooting.- How to use DSTI to Monitor Ports
 - Troubleshoot one problem at a time. Sometimes you luck out and all your problems are resolved with a single solution. My personal favorite is when the DSTI software is not open and with a simple double-click of the desktop icon, all the RTD populates. Unfortunately, not all scenarios have this same simple fix. If there are multiple issues with RTD, prioritize, and focus on resolving the most critical ones first. Changing multiple settings at once to find a fix may make the situation worse.
- Firewalls are made to block things. Firewalls are sometimes the culprit behind data not going through. This is one of the main reasons Daktronics sets all its computers to have the Windows firewalls off. Firewalls are designed to block traffic within the network and can disrupt the flow of stats within the system. Keep in mind that many anti-virus and other security software has its own set of firewalls which also have been known to affect RTD performance.

Remember technical support is available to assist and answer questions about RTD in your system. Our contact is information is listed here.

This post was written by Adam- Daktronics Field Customer Trainer